Using preformatted charts can be a huge time saver, but not all subjects are covered in Datastream, so it is not imaginary having to make a new chart.
How to begin can be found in this thread < click the link
Example:
Comparing the performance of two indexes (AEX and S&P 500 composite)
Menemonics: AMSTEOE,S&PCOMP
Method:
1. click 'charting'
2.
3. Move cursor over the tri angle and select Find new series
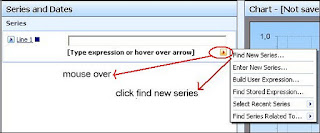
4. (using advanced search)
Search Menu
Noteworthy: both indexes can be selected in a single search, by selecting the 'OR' option (right side search screen) :
5. List of indices. Select BOLD Indices (in this example, the 1st and last page)
6. Click 'use selected'
7. Both indixes are selected. Now it is time to search for the desired data.
Move the cursor over this button to (pre)select:
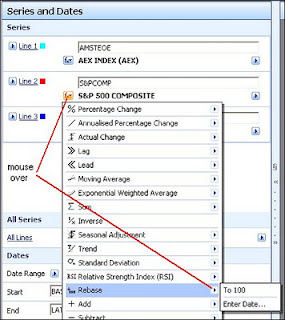
8. resulting chart:
Basic information on financial databases: cook books, tips and tricks & economic news
This blog contains schematic easy to grasp - hands on - help in performing searches in economic databases, making work sets and making them inter-exchangeable between the databases.
* Disclaimer. I am not a finance professional. Most posts are the result of personal findings.
Note:
All presented images are scaled and can be enlarged to original size (click the picture).
* Disclaimer. I am not a finance professional. Most posts are the result of personal findings.
Note:
All presented images are scaled and can be enlarged to original size (click the picture).
Search This Blog
10/19/2011
Subscribe to:
Post Comments (Atom)
No comments:
Post a Comment