Basic information on financial databases: cook books, tips and tricks & economic news

This blog contains schematic easy to grasp - hands on - help in performing searches in economic databases, making work sets and making them inter-exchangeable between the databases.

* Disclaimer. I am not a finance professional. Most posts are the result of personal findings.

Note:
All presented images are scaled and can be enlarged to original size (click the picture).

Search This Blog

Showing posts with label IMF. Show all posts

2/04/2014

Macro Economic Data (benchmark rates) - IFS, World Bank open data, UN Monthly bulletin of statistics, Eurostat and Datastream compared

How to compare country performance if you arer not interested in the opinions of the rating agencies, or when you are interested in the criteria they use in order to rate countries?

This post aims to show a handful options to retrieve macro economic data.
Shown are examples from IFS, World Bank open data, UN Monthly bulletin of statistics, Eurostat and Datastream.

For Example: Interest rates.
Generally Government Bonds asre considered Risk Free investments (high guarrantee of money back, plus interest) The interest is considered the general inerest rate of any given country. The higher the interest a country has to pay when a bond matures, the riskier the investment is considered. Country ratings by the rating agencies like Moody's, Fitch en Standard & Poors are based on this concept.

IFS (International Financial Statistics - IMF)
Is, when you know the route, actually very simple.


- Choose Data Source


- IFS


Select Country


This table shows exchange rates, interest rates (T-Bills, or risk free) , GDP etc.


World Bank (open data)
Starting page.


By country opens the option for an interactive map. (e.g. China)
Steps: by Country > select country name > (scroll down until )


Also optional is is Button Development Indicators.


 Next > Data Bank (annuals)


The Link Indicators provides 5 yr figures
The option By topic:

United Nations Monthly Bulletin of Statistics


Most selections can be made here.
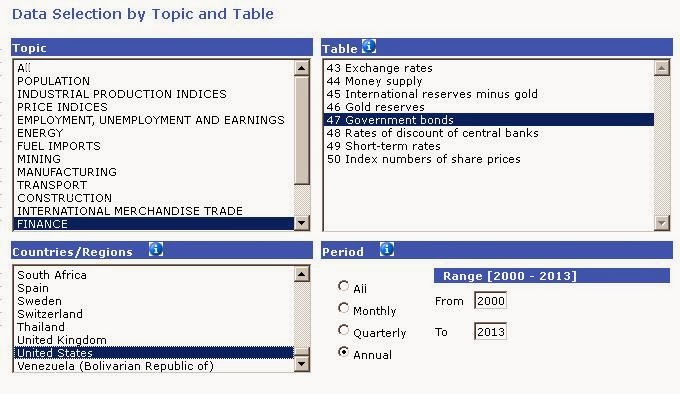


Results


Eurostat (EU)


Results


Datastream
(assuming you are familiar with Datastream, otherwise I refer to these pages  = all my blog items dfealing with Datastream)
Method: I'll be searching for the 10y Germany benchmark bond, which represents the interest rate.

 Selecting Interest rates Advanced Criteria Search


- interest rates


Criteria search Germany benchmark


 Results


You can also use the Free Text search
 Search term benchmark and then select interest rates (you can play with this)


Next select Germany. As you can see the 10y bonds are already presented.


The rest is the same as in tyhe advanced example.
 
Another way of retrieving the interest rates is to work with Bond Indices (risk free).
Example is through the Free text Search.


Results.


2/26/2013

Factors country ratings

Last weekend the UK lost its AAA status.
BBC < link
"Moody's said the government's debt reduction programme faced significant "challenges" ahead."

Three factors come into play when countries are rated.
But in short, it shows how likely any investor - be it company or government bonds - can expect his invested money back.
Tradionally people/ companies invest in bonds as they tend to be more stable and less subject to ups and downs in the financial market. The down side is that the turn out (investment plus contracted interest) is lower than high(er) risk investments.
Governments issue bonds in order to help them cope with their deficit, so to even their national balance.
The government debt (national debt, public debt) is the debt any govenrment owes to others and have to be paid back.
To get an insight of national debt I used database Datastream, went looking for (national) economics data. Search term debt, and as a source I both checked Eurostat and IMF World Economic Outlook.The fig shows figures from IMF.


 The outome looks like this


Government deficit is the amount of balance between income/ expenditure of any government. If the balance is in the plus, debt will decrease as the can be redeemed, if it is in the minus, debt will grow.
When the government balance isn't in the black or deep in the red govenrment debt will grow. The likeliness that a government will be able to pay his due decreases.


Investors become more and more concerned about their investments or became reluctant to make any in government bonds.


So a govenrment has to promise to pay back a higher interest in order to attract investors. This results in higher interest rates.


Now, there is the rule of thumb that once interest exceeds 7% a government won't be able to pay back his debt. In the international financial world this is the moment when the international community urges the government to austerity and take harsh measures are urged / forced in order to get things back in order. We only need to thin kof Greece.


Bonds in a country threaten to be marked as junk bonds. (very high interest, but the likeliness of getting your money back is low)


(fig: long term interest rates)


Weblecture on country ratings

Benchmark bonds (10y)  10Y Benchmark bonds are related to the interest rates and so an indication of any country's health. In Datastream benchmark bonds can, therefore, be found in Interest rates, instead of Bonds & Convertibles.


What the CRA (Credit rating Agencies) like Moody's, Fitch and S&P do, is base their judgement on the factors mentioned above. But you could also say, thet if a CRA downgrades a country, that it will have a negative effect on its national economoy.
In other words: Credit ratings feed their own downgrading.
And is a country supposed that spiral downward?
It's one of the reasons that some people claim that CRAs should be banned, or at least, given much less credit (pun) than they are granted now.

Links 

Euro countries in distress

S&P Sovereigns rating list

Country rating chart

The Guardian : How CRAs rate countries


10/12/2011

Did we really get wealthier? Find out.

An article (blog) by John Cassidy in the New Yorker painted a picture where in forty years time the annual income of the average American hasn't grown. Measure this to increased cost of living and the avaerage will have become poorer. (See:  Poverty and Income in America: The Four Lost Decades and NY Times Soaring Poverty Casts Spotlight on ‘Lost Decade’; Sabrina Tavernisse)
Some figures form these articles:
2.6 million people living under the poverty line, in US today (stated $ 22,314 in 2010)
Average household $ 49,445 (compare 1999: $ 53,252)
According to the Census figures, the median annual income for a male full-time, year-round worker in 2010 — $47,715 — was virtually unchanged, in 2010 dollars, from its level in 1973, when it was $49,065, said Sheldon Danziger, professor of public policy at the University of Michigan
Now, it is interesting to verify the data from the articles.
I used Datastream to globally check the trends the articles claim.
Method: Time series > charting > new chart.
Charting is fairly easy to use.
I rebased all data to 100 so I could present all data in a sigle chart.
The result from my search is shown underneath.

In a table (not rebased):