In Datastream's Time Series menu it's only possible to generate one single Time Series.
Datastream features ' Request Table ' , to circumvent that and create multiple Time Series.
This blog explains with a simple example what to do.
Example workset:

(copy, CTRL-C)
Time Series menu:
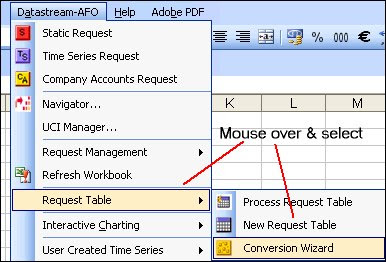
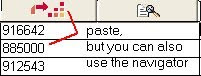
After starting Request Table, paste the workset into the proper fields. It's is also possible to press the Navigator button and create a table from scratch.
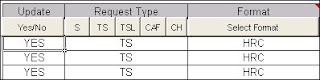
 Next: adjust all fields to the required preferences
 (like the time series)
Click the buttons above the columns to select.
Update Yes/NO
Request Type: Static (S), Time series (TS), Time series list (TSL), Company accounts (CAF)
Format: (output) things like headers, row titles etc.
Datatypes, functions, CA (for CAF)
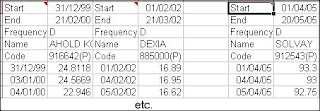
Now, here is the trick: for each item it is possible to create its own time series
(included start date and end date)
Frequency: Daily, weekly, monthy, quarterly and yearly
Example: (note the different Time series)

Next it is time to set the Data Destination.
This demands some rather complicated actions.
Just follow the instructions.
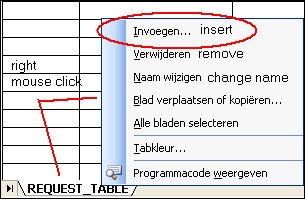
First: creating a new Work sheet (the destination of your search)
Right Mouse click > insert new work sheet
(might differ per Excel version)
Now, press this button:

Another screen pops up:
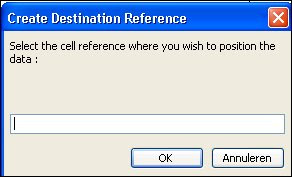
Click the new work sheet TAB and click the first top cell
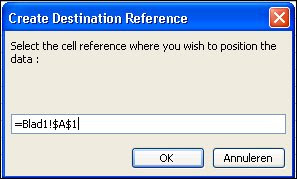
Press OK
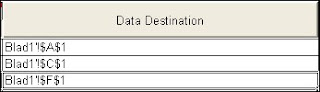
Repeat untill all funds are done:
Finally, press this button:
All data is transported to the new work sheet.
Result: