(changed, Dec. 12, 2014)
Datastream offers a wide range of
ready made expressions and functions, which can save considerable time compared
to doing your own calculations. Think of (standard)Deviation, Moving average,
Cumulative sum etc.
Charting
Menu
This a a "dirty, but
easy" method of finding expressions and functions in Datastream.

Open naviator
In Criteria selection press link
Charting

The charting screen opens
It can happen that the results of
another user are presented.
Clear the data with the white
leaflet.
If you want to search for items and
data, the arrow buttons open new menus.
(examples)


The principles are similar to the
regular search screens.
Comparing a fund with an index
might produce a useless chart (equities and indexes are different entities,
after all)

Absolute values
Note the Ahold line (blue)
Shown are the default
datatypes (price)
There are ways to make this comparison more useful.
Return Index Ri

These are still absolute values... better is to go for relative values/ changes..
changes like moving average.
MAV#(AMSTEOE(RI),1Y) and
MAV#(H:AH(RI),1Y) or PCH (percentage change)
Button ƒx calls up a menu
Mouse over:

Note the bottom three options.
USE stored expressions...
After pressing the option the following
(large) menu appears:
Note ratios and regression, risk and volatility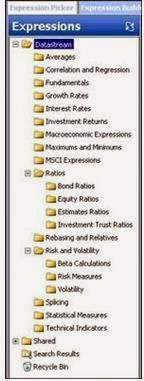
Sticking to Return Index and Moving
Average, filterings result in
(note search term in top bar)

Moving average

Historical Beta

As you can see
searching for expressions like betas and such with this menu is not
complicated.
All presented
expressions and formulas can be copied and used in another Datastream menu.
When you're not
interested in a chart but in figures, another option is to use the
Datastream Menu (Expression picker/ builder)
From the Datastream
menu press:

The result looks familiar. But pay
attention to the 2nd TAB.


When this is too hard core, there is the same ƒx button available on the menu screen:

Moving average:

Looking
up Expressions in the Extranet:
Popular
functions and expressions < click to open
Mentioned are:
Percentage change
Historical Beta
Moving average
Annualised volatility
etc.
Also look up info in these posts:
A couple
of terms
1)
Volatility
Volatility refers to the amount of
uncertainty or risk about the size of changes in a security's value. High
volatility means that the price of the security can change dramatically
over a short time period in either direction.
Measuring:
A statistical measure of the
dispersion of returns for a given security or market index. Volatility can
either be measured by using the standard deviation or variance between returns
from that same security or market index. Commonly, the higher the volatility,
the riskier the security.
Historical
Volatility
The realized volatility of a
financial instrument over a given time period. Generally, this measure is
calculated by determining the average deviation from the average price of a
financial instrument in the given time period. Standard deviation is the most
common but not the only way to calculate historical volatility.
Implied
volatility
In addition to known factors such
as market price, interest rate, expiration date, and strike price, implied
volatility is used in calculating an option's premium. IV can be derived from a
model such as the Black-Scholes Model.
The estimated volatility of a
security's price. In general, implied volatility increases when the market is bearish and decreases when the market is bullish. This is due to the common belief that
bearish markets are more risky than bullish markets.
Bearish
Believing that a particular
security, a sector, or the overall market is about to fall.
Bullish
Believing that a particular
security, a sector, or the overall market is about to rise.
(Sources Investopedia and
Investorwords.com)

No comments:
Post a Comment