Basic information on financial databases: cook books, tips and tricks & economic news

This blog contains schematic easy to grasp - hands on - help in performing searches in economic databases, making work sets and making them inter-exchangeable between the databases.

* Disclaimer. I am not a finance professional. Most posts are the result of personal findings.

Note:
All presented images are scaled and can be enlarged to original size (click the picture).

Search This Blog

Showing posts with label balance sheet. Show all posts

9/13/2019

Shareholder letter - 10-K form, annual report

Key Elements 10K

  • The 10-K is generally more detailed than the annual report,. It doesn't have a PR component, it is mandatory, if the company is publicly traded and is traded in the US
  • Publicly traded companies will complete both annual report and 10K
  • Both deal with financial performance over the last year of the company
  • The 10-K can be found on the SEC website, while the annual report should be readily available on the company’s website.
  • Source Investopedia

!! Publicly traded companies in the US << the SEC tneeds to know their finances: 10-K.

What Is an Annual Report?

There is much more flexibility in an annual report, particularly if your business is small. An annual report is a document a company prepares each year to detail its performance.
It can also be dressed up for PR's sake.
Most investors get hold of Annual report and not on 10K. Some comps choose to send 10K to both Sec and shareholders.

Components of a 10-K

There are five major components of a 10-K, with businesses personalizing each of those sections with their own information.
1. Overview of the business
2. Risk factors
3. Five-year overview of its financial data
4. Management’s Discussion and Analysis of Financial Condition and
5. Results of Operations, which is where the business has the freedom to summarize the past year, and ends with financial statements.
Once 10K is filed it becomes public information
10K is audited

Information in an Annual Report

1. Primarily for the shareholders.
2. The goal is to provide a detailed accounting of your business’s financial health.
3. Detailed financial statements
4. But you’ll also break them down using your own narrative.
You’ll do this through a letter to the shareholders from your CEO, a section with operational and financial highlights and notes that you append to the financial statements.
(Source:finance.Zacks.com, feb. 2019)

10Q?
. Less detail than 10K
. Q stands for Quarter(ly) filing
. 10Q not always audited


8K?
Only with special events
. bankruptcy filing
. acquisition or resignation of a key member of your board of directors

Risk Factors

As an investor, it’s important to know what to look for when you’re reviewing a company’s 10-K. Here are some of the most notable components of a 10-K:
  • Chairman’s Letter – The chairman’s letter can actually be one of the most telling parts of the 10-K. If possible, gather multiple years of reports and compare what the chairman says from one year to the next. Were they able to accomplish the goals the chairman outlined in a previous year’s letter?
  • Risk Factors – Item 1A details the risks a business faces. They’re urged to only list risks that can affect the securities that are being offered. Risks can include lack of an operating history and unprofitable operations in the most previous period.
  • Financials – Item 6 will provide a brief overview of the company’s financials over the past five years. If you’re considering investing, this could give you a decent picture of where the company may go in the future.
  • Management’s Discussion – Item 7 gives the business the opportunity to offer its own perspective on the previous year’s results. You may also find here a few risks you should take note of before investing.
  • Financial Statements and Supplementary Data – Item 8 has all of the appended information you’ll need to get the full picture of how the company performed. This data will have been audited and has the business’s income statement, balance sheets, cash flow statements and the statement of stokholders’ equity.

Databases containing 10K or Shareholder Letters
EDGAR SEC https://www.sec.gov/edgar.shtml

Audit analytics
https://www-auditanalytics-com.vu-nl.idm.oclc.org/ > points  to EDGAR

Factset through Screening or Filings?


 Source Investopedia
 (Source:finance.Zacks.com, feb. 2019)

8/16/2016

Most important financial ratios in databases

The most commonly used ratios in finance.
How to interpret the text:
Data types presented in RED are downloadable data
If ratios or their components are not ready for download I try to present ways to calculate them (indirectly)
1. Debt to equity ratio
2. Current ratio
3. Quick ratio
4. Return on equity (ROE)
5. Net profit margin

1. Debt-to-Equity Ratio
Total Liabilities / Shareholders Equity
Shareholder equity = book value x number of shares

Compustat
Direct download: DLC 
DLC represents the total amount of short-term notes and the current portion of long-term debt (debt due in one year).
LT = Total liabilites
BKVLPS (book value per share)
(CSHOCommon Shares Outstanding
Formula:
LT / (BKVLPS x CSHO) = debt to equity

Amadeus

Book value per equity =  Book value per share x number of shares outstanding
Instead of  Book value of equity, Market Value ( MV) can be used (market capitalisation)
(closing price x shares outstanding)
In Amadeus only closing price frequencies monthly and weekly, not daily 
And: market value per year can be downloaded 
Total liabilities = current liabilities + long term liabilities

Formula:
Total debt / total (shareholder) equity = Total liabilities / (market capitalisation number of shares outstanding) OR (market capitalisation x book value per share)

Datastream*

WC03351 Total liabilities: 
WC03995 Shareholder equity: (book value per equity)
NOSH Number of shares outstanding
Instead of Book value of equity, Market Value ( MV) is used (market capitalization)
Market Value MV = share price (P) x number of shares (NOSH) (market capitalisation)

Formula:
1. WC03351 / WC03995
2. WC03351  / MV

*) using search terms debt equity ratio in datatypes provides to following data producing datatypes:
WC08231 (total debt % common equity); WC08221 (total debt % total capital/std); WC08231A (total debt % common equity); WC08231R (total debt % common equity) !! Not all  companies provide data. Error types like No data values found; no world scope data; access denied

For more downloadables on income statement and balance sheet see this

2. Current Ratio (working capital ratio)
Current Assets / Current Liabilities

Compustat

Current assets total / current liabilities = current ratio
ACT = Current assets total
LCT = Current Liabilities - Total

Formula:
Current ratio = ACT / LCT  

Amadeus

Formula:
Current ratio Current assets total   / current liabilities

Datastream

Formula:
WC08106 Current ratio = (current assets total  [WC02201] / current liabilities [WC03101] )
Only industrials apply

3. Quick Ratio (quick assets ratio)
(Current Assets – Inventories) / Current Liabilities

Compustat

INVT -- Inventories - Total
ACT = Current assets total
LCT = Current Liabilities - Total

Formula:
(ACT - INV) / LCT

Amadeus
Inventories not in AMADEUS

Datastream

Quick ratio WC08101
Inventories total WC02101
Current assets WC02201
Current liabilities WC03101

Formula:
(WC02201 - WC02101) / WC03101 = WC08101

Not all companies provide data

 4. Return on Equity (ROE) (return on net worth)
Net Income / Shareholder's Equity or
(net earnings (after taxes) - preferred dividends) / common equity

Compustat

NI Net income
(BKVLPS x CSHO) shareholder equity
BKVLPS (book value per share)
CSHO Common Shares Outstanding

Formula
NI / (BKVLPS x CSHO)

Amadeus

P/ L for period = Net Income
Book value per share x number of shares outstanding = Book value per equity
ROE using net Income %

Formula
(P/L) / (Book value per share x number of shares outstanding) = ROE

Datastream

ROE (total): WC08301
WC03995 Shareholder equity: (book value per equity)
NOSH Number of shares outstanding
Instead of Book value of equity, Market Value ( MV) is used (market capitalization)

Market Value MV = share price (P) x number of shares (NOSH) (market capitalisation)

Formula: WC01001 / MV = WC08301 OR WC01001 / WC03995 = WC08301

5. Net Profit Margin
Net Profit / Net Sales 

Compustat

Gross profit margin
Gross Income / Net Sales or Revenues * 100 = UGI / SALE x 100
Gross profit: GP (loss)
Gross income: UGI
. the difference between sales or revenues and cost of goods sold and depreciation.
Net sales or revenues: SALE (sales/turnover)
gross sales and other operating revenue less discounts, returns and allowances. 
REVT = Revenue - total
GP = UGI / SALE x 100

Addition Compustat from (copyright) WWU Münster Data- items and ratios

Amadeus

Gross profit
Profit margin (%)
Sales

Formula: 
Gross profit / sales (not exactly)

Datastream

DWNM = net profit margin
WC01001 Net sales or revenues 
WC01540 Net profit( operating income)  
* Components can't be all downloaded. Not all companies provide data


LINKS
Compustat: For more downloadables on income statement and balance sheet see this
Amadeus: For more downloadables on income statement and balance sheet see this
Datastream: for more downloadables on income statement and bsalance sheet, see this


5/15/2013

Tobin's Q Ratio. What is and where can I find it?

Tobin's Q Ratio provides information on how well a company's investments pay off.
This post focuses on  databases and the availability of the ratio or its components.

Tobin's Q

Market value of assets / replacement value of assets = TQ
or
(Equity Market value + liabilities market value) / (equity book value + liabilities book value) = TQ


On macroeconomic level:
Value of stock market / corporate net worth = TQ

Values larger than 1 say investments have been good.

Datastream:
Datatypes in red can be downloaded (In short: you can calculate the Tobin's Q ratio yourself.)

In Datastream it can be downloaded directly using the following formula
DPL#((X(WC08001) + X(WC03351)) / (X(WC03501) + X(WC03351)),6)

Put this rule in the data types field.
X stands for the selected equity or equities

The WC datatypes are datatypes from the balance sheet (provided by World Scope)
According to the formula liabilities book value and liabilities market value are the same (WC03351) = Total liabillities
 

Datatypes involved:

WC08001 = market capitalization (annual);  
MV = market value
WC03351 = total liabilities
WC03501 = common stock

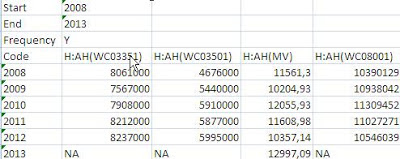
Datastream output:


Tobin's Q can be calculated from the downloaded data.


Using the formula:
DPL#((H:AH(WC08001)+H:AH(WC03351))/(H:AH(WC03501)+H:AH(WC03351)),6)


Other Datastream formula's: (*expression builder/. finder in TSenu)
X(DWEV)/X(DWTA)*1000 (Tobin's Q 2)

(MARKET VALUE OF FIRM AS CAPTURED BY ENTERPRISE VALUE DIVIDED BY BOOK VALUE OF TOTAL ASSETS)

(X(MVC)*1000.000+PAD#(X(WC03451)~PCUR,C)+PAD#(X(WC03251)~PCUR,C)+PAD#(X(WC03051)~PCUR,C))/PAD#(X(WC02999)~PCUR,C)


MARKET VALUE OF EQUITY PLUS BOOK VALUE OF PREF STOCK AND DEBT DIVIDED BY BOOK VALUE OF TOTAL ASSETS
WC03451, WC03251, WC03051, WC02999

 Also see: Ratios, values and other instruments from the balance sheet: Datastream


Compustat
Datatypes in red can be downloaded

Market value = MKVALT (North America database)
Calculation: stock price x number of shares  (Global database)

Liabilities: LT*
Market value = stock price x number of shares = MKVALT (North America)
Equity book value = Book value per share BKVLPS  (North America)
Liabilities book value = Liabilities market value = LT


!! Unfortunately these data can not be downloaded in the Global database !!

Formula North America:
(MKVALT + LT) / (BKVLPS + LT)

Output Microsoft


*) LT
This item represents current liabilities plus long-term debt plus other noncurrent liabilities, including deferred taxes and investment tax credit.
This item is a component of Assets ? Total/Liabilities and Shareholders' Equity ? Total (LSE).
This item is the sum of:
  1. Current Liabilities ? Total (LCT)
  2. Deferred Taxes and Investment Tax Credit (TXDITC)
  3. Liabilities ? Other (LO)
  4. Long-Term Debt ? Total (DLTT)  
Using google I found the following formula:
AT + (CSHO x PRCC_F) – CEQ / AT >> Total Assets + (Common stocks outstanding x price closing fiscal) –  CEQ 
(CEQ -- Common/Ordinary Equity – Total) / total assets

Addition Wharton (cop WWU Münster) Data items and ratio's in Wharton 

 Also see
Ratio's, values and other instruments from the balance sheet: Compustat

Amadeus (Bureau van Dijk). (focus on Europe; no banks no financials)


Market value of assets / replacement value of assets = TQ
or
(Equity Market value + liabilities market value) / (equity book value + liabilities book value) = TQ

Total liabilities = Assets - shareholders equity (book value per share x number of shares) = total liabilities
Equity book value: Total Assets - (total) liabilities = shareholders'equity (book value of equity)

Book value per share = Book value per equity / number of shares outstanding

Market value: stock price x number of shares
Amadeus only weekly, monthly and annually

            ( (stock price x number of shares) + (total assets - shareholder equity) )
___________________________________________________________________________   = TQ

( (book value per share x number of shares outstanding) + (total assets - shareholder equity) )

Also see: Ratios, values and other instruments from the balance sheet: Amadeus

Bankscope (Bureau van Dijk) Focus ob public banks
Search criteria in this example: active, listed, public, commercial banks from Neth, Ger and US

Market value of assets / replacement value of assets = TQ
or
(Equity Market value + liabilities market value) / (equity book value + liabilities book value) = TQ

Number of shares
Book value per share
Total assets
Stock price only weekly, monthy, annually
Market value: stock price x number of shares
Total liabilities = assets - book value per share
Total liabilities = Assets - shareholders equity (book value per share x number of shares) = total liabilities
Equity book value: Total Assets - (total) liabilities = shareholders'equity (book value of equity)

Book value per share = Book value per equity / number of shares outstanding

Tobin's Q:
                 ( (stock price x number of shares) + (assets - book  value per share) )
____________________________________________________________________________


( (book value per share x number of shares outstanding) + (total assets - shareholder equity) )